

Under Trump (2017–2021): Border encounters fluctuated, with a notable decrease in early 2017, reaching lows of approximately 16,000 apprehensions in April 2017. However, numbers increased in subsequent years, peaking at over 850,000 in fiscal year 2019. The onset of the COVID-19 pandemic in 2020 led to a decline in encounters due to global travel restrictions. Under Biden (2021–2025): Encounters surged, with over 2 million reported annually from 2021 to 2023, marking record highs. Factors contributing to this increase include global migration trends and perceptions of more lenient U.S. immigration policies. In mid-2024, monthly apprehensions began to decline, reaching levels comparable to those in 2020.
🚫 Deportation Trends
Trump Administration: Approximately 1 million deportations occurred over four years, with annual figures ranging from 226,000 to 267,000. Biden Administration: Deportations increased, with over 271,000 unauthorized immigrants deported in fiscal year 2024, surpassing any annual total during Trump’s term. This rise is attributed to streamlined deportation processes and enhanced diplomatic efforts with other countries.
⚖️ Policy Approaches
Trump’s Policies: Implemented restrictive measures, including the “zero-tolerance” policy leading to family separations and the “Remain in Mexico” program. Utilized Title 42 during the COVID-19 pandemic to expel migrants without standard immigration proceedings. Biden’s Policies: Initially reversed several Trump-era policies, emphasizing more humane treatment of migrants. Faced challenges with increased migration, leading to the reinstatement of certain restrictive measures and the introduction of new asylum limitations in 2024.
In summary, while illegal border crossings were generally higher during Biden’s first term compared to Trump’s, deportations also increased under Biden. Both administrations faced unique challenges and implemented varying strategies in response to evolving migration patterns and political pressures.
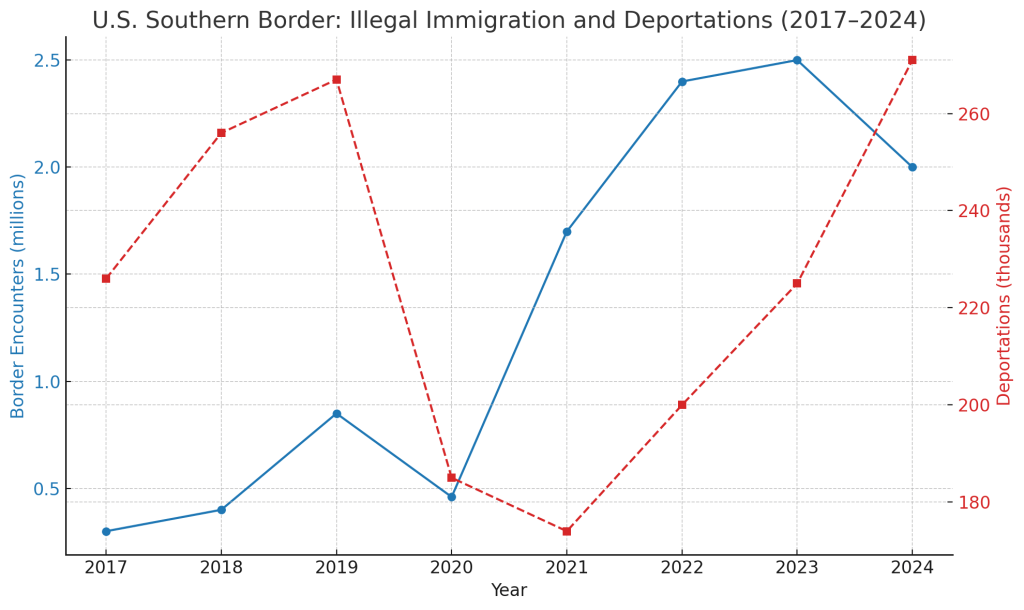
Here’s a graph comparing estimated U.S. southern border
encounters and deportations from 2017 to 2024:
Blue line: Illegal border crossings (in millions) — note the surge during Biden’s term.
Red line: Deportations (in thousands) — showing an increase under Biden, surpassing Trump-era annual figures by 2024.
